Ofsted And Performance
Please click to see...
Willesborough Junior School's Ofsted Report - March 2023
OFSTED Parent View
Willesborough Infant School's Ofsted Report - September 2022
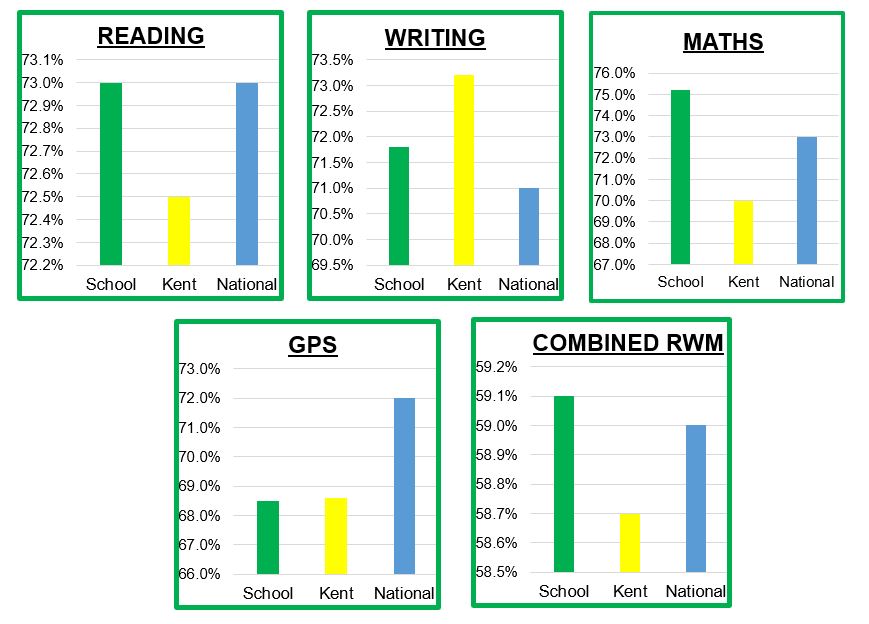
End of Key Stage 2 Assessment Data 2024
Pupils were graded against whether or not they achieved the expected standard. The results for Reading, Maths and Grammar, Punctuation and Spelling (GPS) are based on a test result. Whereas, the results for Writing are based on teacher assessment. The table below shows the percentage of pupils achieving the expected standard or greater for the academic year 2023-2024:
|
|
School |
Kent |
National |
|
Reading |
72.3% |
75.2% |
74% |
|
Writing |
83.2% |
73.3% |
72% |
|
Maths |
84% |
71.1% |
73% |
|
GPS (Grammar, Punctuation & Spelling) |
75.6% |
69% |
72% |
|
Combined Reading, Writing & Maths |
68.9% |
60.8% |
61% |
Each pupil’s achievement in Reading, Maths and GPS was measured using a scaled score. The scaled scores range from 80-120, with 100 being deemed as reaching the expected standard and 110 deemed as reaching a higher level of attainment.
Average scaled score for Reading – 104.7
Average scaled score for Maths – 105.9
Average scaled score for GPS (Grammar, Punctuation & Spelling) – 104.8
The table below shows the percentage of pupils achieving a higher level of attainment (a scaled score greater than 110) in the academic year 2023-2024:
|
|
School |
Kent |
National |
|
Reading |
31.9% |
30.4% |
28% |
|
Writing |
7.6% |
14.5% |
13% |
|
Maths |
31.9% |
22.5% |
24% |
|
GPS (Grammar, Punctuation & Spelling) |
32.8% |
28.2% |
32% |
|
Combined Reading, Writing & Maths |
7.4% |
8.3% |
8.0% |
The percentage of children attaining the expected standard or above in 2024